Reading
For next week, read:
- Borges. The Garden of Forking Paths. pp. 29-35
- Six Selections by the Oulipo. pp. 147-189
- Paik. Cybernated Art. pp. 227-229
SIGGRAPH video
Visualization
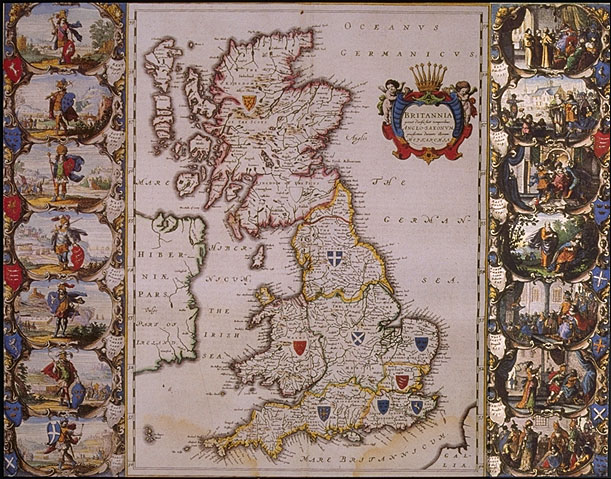
Maps
William Playfair
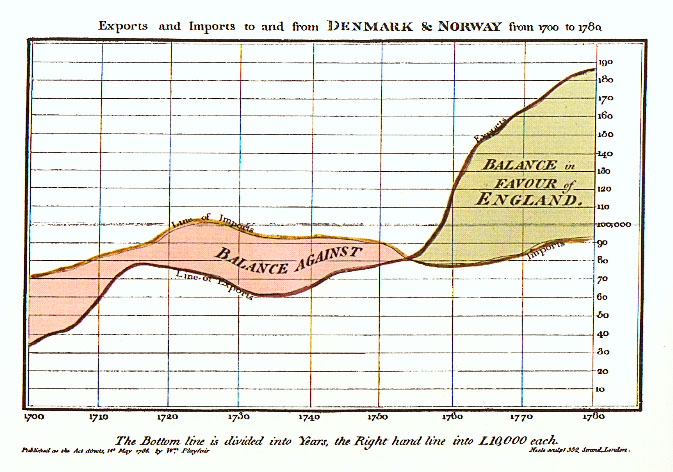
line graphs, bar charts, pie charts
1780s - 1820s
Charles Minard

map + time + troop numbers + temperature
Graphical Integrity

Bottom of graph not zero

Not-to-scale
(& confusing perspective)

Linear size vs. area

Raw numbers, without appropriate corrections

Chartjunk - Moire' vibrations

Chartjunk - Gratuitous 3D


Data-Ink ratio

The text and layout of this document is by Dave Pape, and is released under a Creative Commons License.