For Laurence Williams' book "An End to Global Warming" (see also the Elsevier page), I created a series of maps showing the possible effects of rising sea levels; they were used for the book cover and interior illustrations.
The maps were derived from the GTOPO30 dataset, a 30 arc-second resolution digital map of global topography. Border data came from the NIMA Vector Map Level 0.
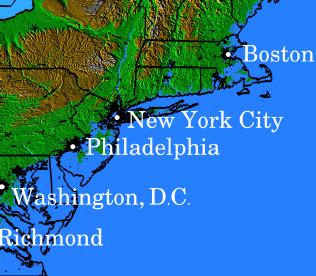
The maps show the affected areas if sea levels were to rise by 1, 3, 10, 30, and 100 meters. They include a global map, and more detailed maps of Europe and the east coast of North America. They also highlight several major cities that would be flooded, or at least severely affected, by these changes. (I should point out that I am not a climatologist/geologist/oceanographer/etc; the exact effects of the sea level rise would of course be more complex, but these maps give an idea of the scale and regions likely to be affected by the given changes.)
The maps that I've placed on-line are:
Last updated 13 April 2005.
home page